Transforming Complex Data into Actionable Insights

Data visualization is crucial for modern businesses as it helps transform complex and large datasets into easily understandable and actionable insights. Here’s why it matters:
Our Data Visualization Services provide innovative solutions that help you transform complex data into clear, actionable insights:

We create custom, interactive dashboards that present KPIs, trends, and real-time analytics in a visually appealing format.

Our BI experts assist in choosing the right tools, implementing BI solutions, and optimizing visualization strategies to drive business performance.

Collect and analyze data across all sales channels to get a 360-degree view of your customers and operations, enhancing the customer journey across platforms.

Our real-time visualization solutions help businesses track performance, customer behavior, and operational efficiency in real-time.

We design tailored visual elements like graphs, charts, heatmaps, and geospatial maps for better analytics representation.

We integrate multiple data sources, automate reporting, and ensure accurate visualization for businesses.
We cater to a diverse range of industries, including:
Healthcare
Finance & Banking
Retail & E-commerce
Manufacturing
Logistics & Transportation
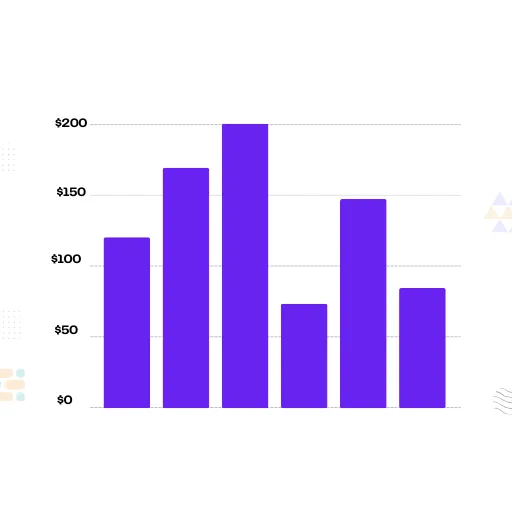
Best for comparing values across categories.
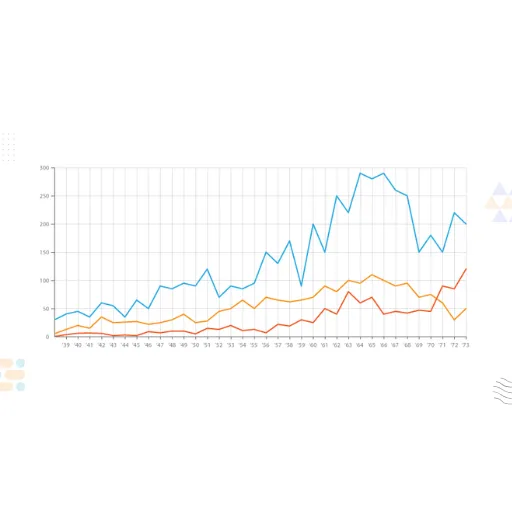
Ideal for showing trends over time.
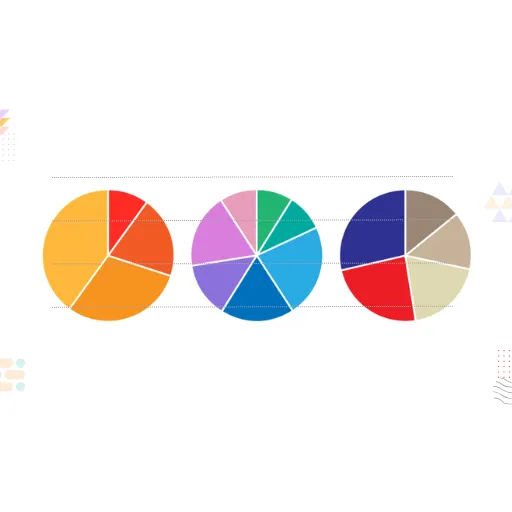
Used to represent proportions within a dataset.

Best for horizontal comparisons.

Show variations in data intensity using colors.
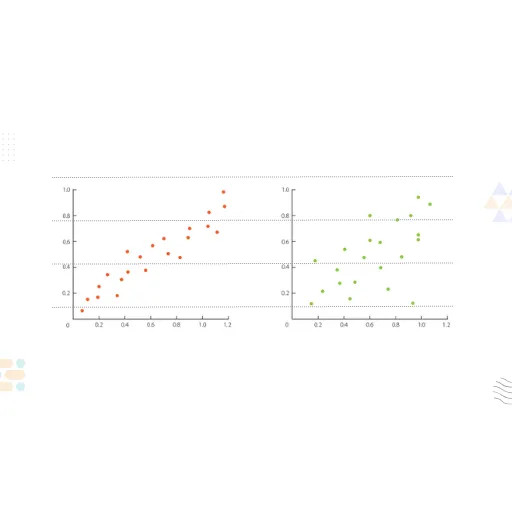
Display relationships between two variables.
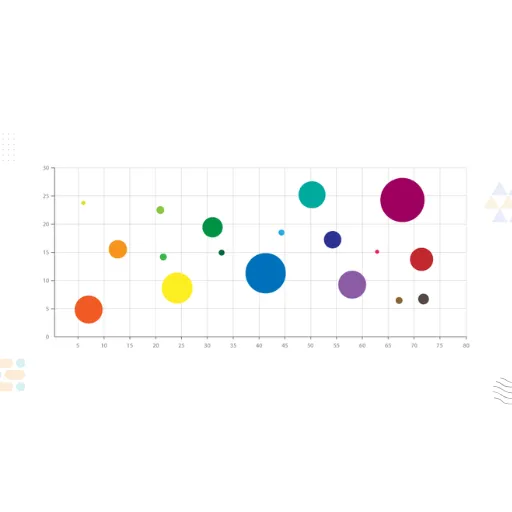
Advanced scatter plot with an additional data dimension.

Visualizing stages in a process like sales funnels.

We cleanse and organize raw data to ensure accuracy and compatibility with visualization tools, including data transformation and normalization.
Choose from a wide range of chart types like bar graphs, line graphs, scatter plots, heatmaps, treemaps, and more, tailored to your specific data and storytelling needs.
Create dynamic dashboards that allow users to explore data interactively by filtering, drilling down, and comparing different datasets.
We prioritize crafting narratives through data visualization, highlighting key insights and trends in a clear and engaging manner.
Utilize industry-leading data visualization tools like Tableau, Power BI, Google Data Studio, and more, ensuring compatibility with your existing systems.
Explore additional tools and solutions offered by HashStudioz Technologies to enhance your data analytics and business intelligence capabilities:

Transform complex data into interactive dashboards and actionable insights with Tableau.

Create stunning, shareable reports and dashboards using Google Looker Studio for real-time data insights.

Utilize AWS’s powerful cloud analytics tools to manage, analyze, and visualize your data at scale.

Accelerate your analytics journey with Microsoft Azure's robust data processing and machine learning tools.

Harness the power of Google Cloud for advanced data processing, storage, and real-time analytics.

Manage and analyze vast amounts of unstructured data with Hadoop's distributed computing power.

Use Apache Spark's distributed computing and real-time features to speed up data processing and analytics.

Modernize your data storage and analytics with Snowflake's secure and scalable data warehousing solutions.
We work with Power BI, Tableau, Google Looker Studio, AWS QuickSight, Microsoft Excel, and more to build customized dashboards and reports.
Our tailored visual analytics cater to healthcare, finance, retail, manufacturing, logistics, e-commerce, and other industries.
We design real-time, interactive, and AI-driven dashboards that improve decision-making.
Our solutions integrate with ERP, CRM, cloud platforms, and third-party APIs for seamless data connectivity.

Partner with HashStudioz Technologies for expert Data Visualization Consulting Services.


Office No. 902, 9th Floor, Pegasus Tower, A-10, Block A, Sector 68, Noida, Uttar Pradesh 201309

161 W Altadena Dr, Unit 501 STE Altadena, CA 91001-4735

C-205, SM Heights, 3rd Floor, Sector 74, Industrial Area Phase 8B 160055, Mohali

Plot No. 45B, Doon IT Park, Sahastradhara Road, Dehradun, Uttarakhand 248013, India

No 207, A Block, 306, Raheja Towers, Anna Salai, Chennai 600002

273, Sector 8, Imt Manesar, Gurugram, Haryana 122051
 +91-97185 17228
 +1 (408) 757 0570